Updated: October 30, 2025
Protecting your employees is your top priority – and ours. But smart safety investments also deliver measurable returns for your business. These three case studies show how strategic safety improvements can lower your experience modification factor (e-mod), control your work comp costs, and keep your employees safe.
How the premium calculation works
Your workers compensation premium depends on three main factors: payroll, classification rate, and e-mod. A 1.00 e-mod reflects average losses for similar businesses and does not affect premium. An e-mod lower than 1.00 reduces total premium, and one higher than 1.00 inflates it.
Payroll × classification rate × e-mod = premium
The first two factors, payroll and class codes, are objective business traits. You can’t change them to reduce your work comp premium. However, your e-mod is a different story. It’s the one factor you can actively control by improving your loss experience. Here’s how three MEM policyholders achieved this goal.
📍 Read next: How Your Workers Compensation Premium is Calculated

E-mod improvements: 3 policyholder success stories
The following case studies feature actual MEM policyholders. We changed company names to protect privacy, but their stories – and results – are real.
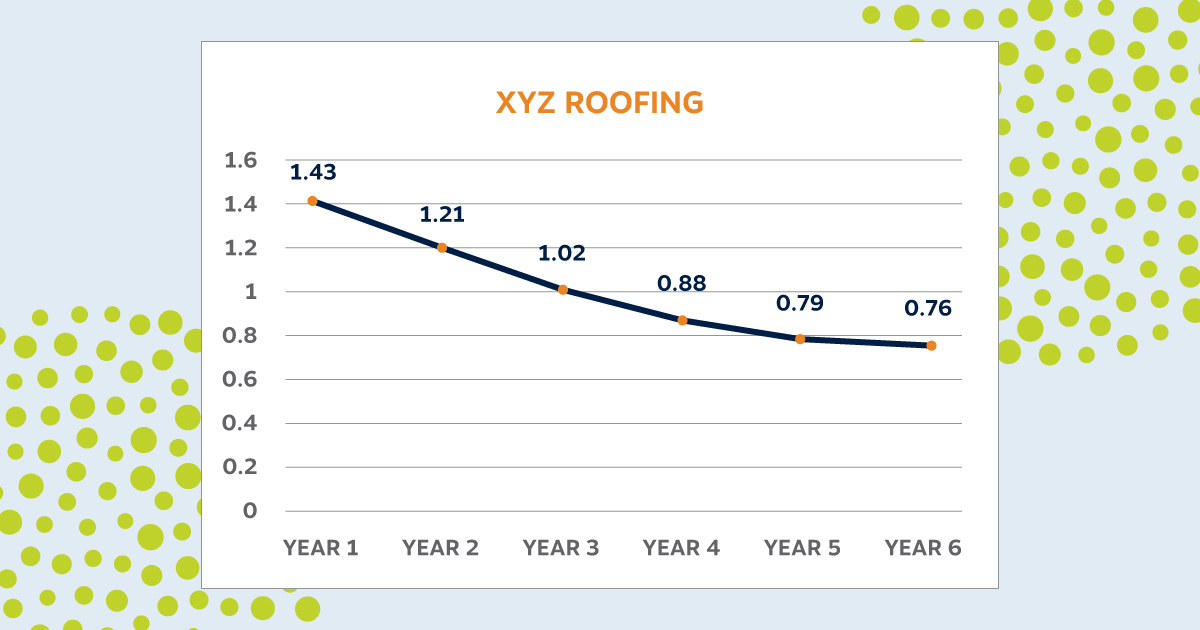
Case study 1: XYZ Roofing
The challenge: As a contractor, XYZ Roofing faced inherent fall risks in one of the most dangerous industries. Their high e-mod was also limiting their ability to bid on the most lucrative projects: A low e-mod signals safety and stability – top priorities for large and government contractors.
The solution: Working with MEM’s Safety and Risk Services (SRS) team, XYZ developed a more comprehensive safety program, including:
- Quarterly safety meetings with our safety consultants to identify and address job site hazards
- Pre-work safety training and job site specific checklists
- Proactive safety resource utilization
- A new managed medical care solution with MEM’s claim experts
The results: XYZ’s commitment to safety delivered dramatic improvements over six years:
| Year | E-mod |
| Year 1 | 1.43 |
| Year 2 | 1.21 |
| Year 3 | 1.02 |
| Year 4 | 0.88 |
| Year 5 | 0.79 |
| Year 6 | 0.76 |
☑️ Total improvement: 47% e-mod reduction. This translated to substantial premium savings and opened doors to higher-value contracts previously out of reach.
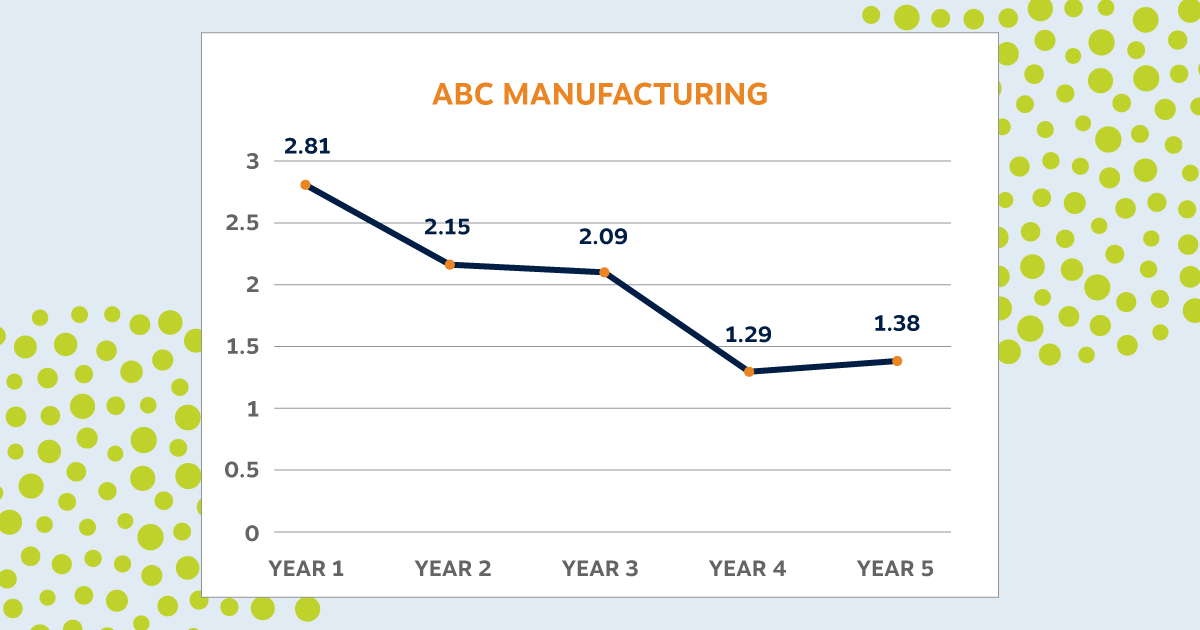
Case study 2: ABC Manufacturing
The challenge: This manufacturer struggled with repetitive motion injuries common in production environments. Balancing safety improvements with productivity demands required expert guidance.
The solution: ABC pulled from MEM’s expertise to create a comprehensive claims management plan and improve its safety culture:
- 24-hour claims reporting protocol to increase efficiency and reduce costs through early intervention
- Report Only claims strategy to pay minor medical-only claims out of pocket (avoiding e-mod impact)
- Partnership with one of our Signature Partner Agencies that reinforced the importance of safety
- Hazard identification programs with our SRS team to prevent repeat injuries
The results: ABC’s approach yielded impressive improvements:
| Year | E-mod |
| Year 1 | 2.81 |
| Year 2 | 2.15 |
| Year 3 | 2.09 |
| Year 4 | 1.29 |
| Year 5 | 1.38 |
☑️ Total improvement: 51% e-mod reduction. Despite a slight uptick in Year 5, ABC maintained a 51% overall improvement, demonstrating the lasting impact of embedded safety practices.
Case study 3: Support Services LLC
The challenge: Providing in-home support services exposed employees to unpredictable environments and safety hazards. Multiple years of high losses created an urgent need for better safety equipment and protocols.
The solution: Support Services LLC benefited from MEM’s safety expertise, services, and programs:
- Actively partnered with SRS for ongoing consultation and hazard assessment
- Developed a return-to-work program, including light duty alternatives to accelerate employee recovery
- Received two MEM Safety Grants to help fund essential safety equipment upgrades
All MEM policyholders are eligible to apply for a safety grant. Learn more about the program. >
The results: Strategic safety investments delivered consistent year-over-year improvements:
| Year | E-mod |
| Year 1 | 2.14 |
| Year 2 | 1.78 |
| Year 3 | 1.61 |
| Year 4 | 1.22 |
| Year 5 | 1.04 |
| Year 6 | 1.02 |
☑️ Total improvement: 52% e-mod reduction. Support Services LLC achieved the most dramatic transformation, reducing their e-mod by 52%.

Understanding the financial impact of reducing your e-mod
These e-mod improvements aren’t just numbers on an underwriter’s computer. They represent real premium savings and competitive advantages.
➡️ Here’s an example: Say a company’s base annual premium is $100,000.
- They started with a 1.63 e-mod, paying $163,000 in total premium.
- After reducing their e-mod 47% (the same as XYZ Roofing above), it was 0.86.
- They now pay $86,000 in premium.
The annual premium difference between these two e-mods is a staggering $77,000.
Plus, in some industries like construction, companies must have an e-mod of 1.00 or lower to bid on large projects and government contracts. E-mod improvement strategies are critical for growth in these industries.
What drove success in these case studies?
We can trace these successes back to two essential strategies that work together to reduce claim frequency and severity: safety and claims management.
Preventing injuries with comprehensive safety programs helps you avoid direct claim costs and the indirect costs of business disruption. Your program should include:
- Written safety rules
- Regular safety meetings
- Post-offer employment testing
- Safety training
- Incident investigation
- Safety equipment and technology
Effective claims management focuses on making sure the injured worker gets appropriate care and minimizing claim costs with strategies like:
- Timely injury reporting
- Telehealth and nurse triage
- Directed medical care when possible
- Return to work plan with modified or light duty
- Post-incident drug and alcohol testing
- Fraud prevention
Pulling these strategies off isn’t easy. Partnering with the right work comp carrier lightens your load by providing insight into your e-mod – plus the safety and claims support to make long-term positive changes.
Your path to e-mod improvement
These case studies prove that strategic safety investments deliver measurable ROI. The companies featured here didn’t achieve these results overnight. Significant e-mod reduction typically takes 3-5 years as claims age out of the calculation. But starting your e-mod improvement journey now gets you one step closer to results like these.
Start taking steps to lower your e-mod today with our complete guide: E-Mod Explained: What It Costs You and How to Improve It >